
Weather Ad Measurement: How to Track ROI on Weather-Triggered Campaigns
Weather-triggered advertising is one of the highest-ROI ad strategies available—but only if you measure it correctly. Traditional ad measurement approaches miss the signal. This guide walks you through weather-specific attribution models, metric frameworks, and platform setups that let you quantify the true impact of weather-based campaigns on your bottom line.
Read time: 12 minutes | Updated: March 2026
Table of Contents
- Why Weather Ad Measurement Is Different
- Key Metrics for Weather-Triggered Campaigns
- Setting Up Proper Attribution
- Platform-Specific Measurement Strategies
- Calculating True ROI
- Common Measurement Mistakes
- Tools and Technology
- Building a Weather Ad Dashboard
- Case Study Examples
- How WeatherTrigger Solves This
- FAQ
Why Weather Ad Measurement Is Different From Standard Ad Measurement
Weather-triggered ads operate in a fundamentally different environment than always-on campaigns. Your audience’s behavior is dictated by environmental variables—temperature, precipitation, wind speed, humidity—that you can’t control but can react to in real time. This creates both opportunity and complexity in measurement.
The core challenge: Weather is a confounding variable in traditional attribution models. When someone converts after seeing a rain-triggered umbrella ad on a rainy day, how much of that conversion is due to the ad versus the person’s actual need for an umbrella? Classical last-click attribution can’t answer this.
Standard ad measurement assumes relatively stable demand. You run an ad, people respond, you measure the lift. Weather-triggered campaigns invert this: you’re amplifying messaging during windows of natural, weather-driven demand. The measurement question becomes: How much incremental revenue did my ad amplification generate beyond what would have converted anyway?
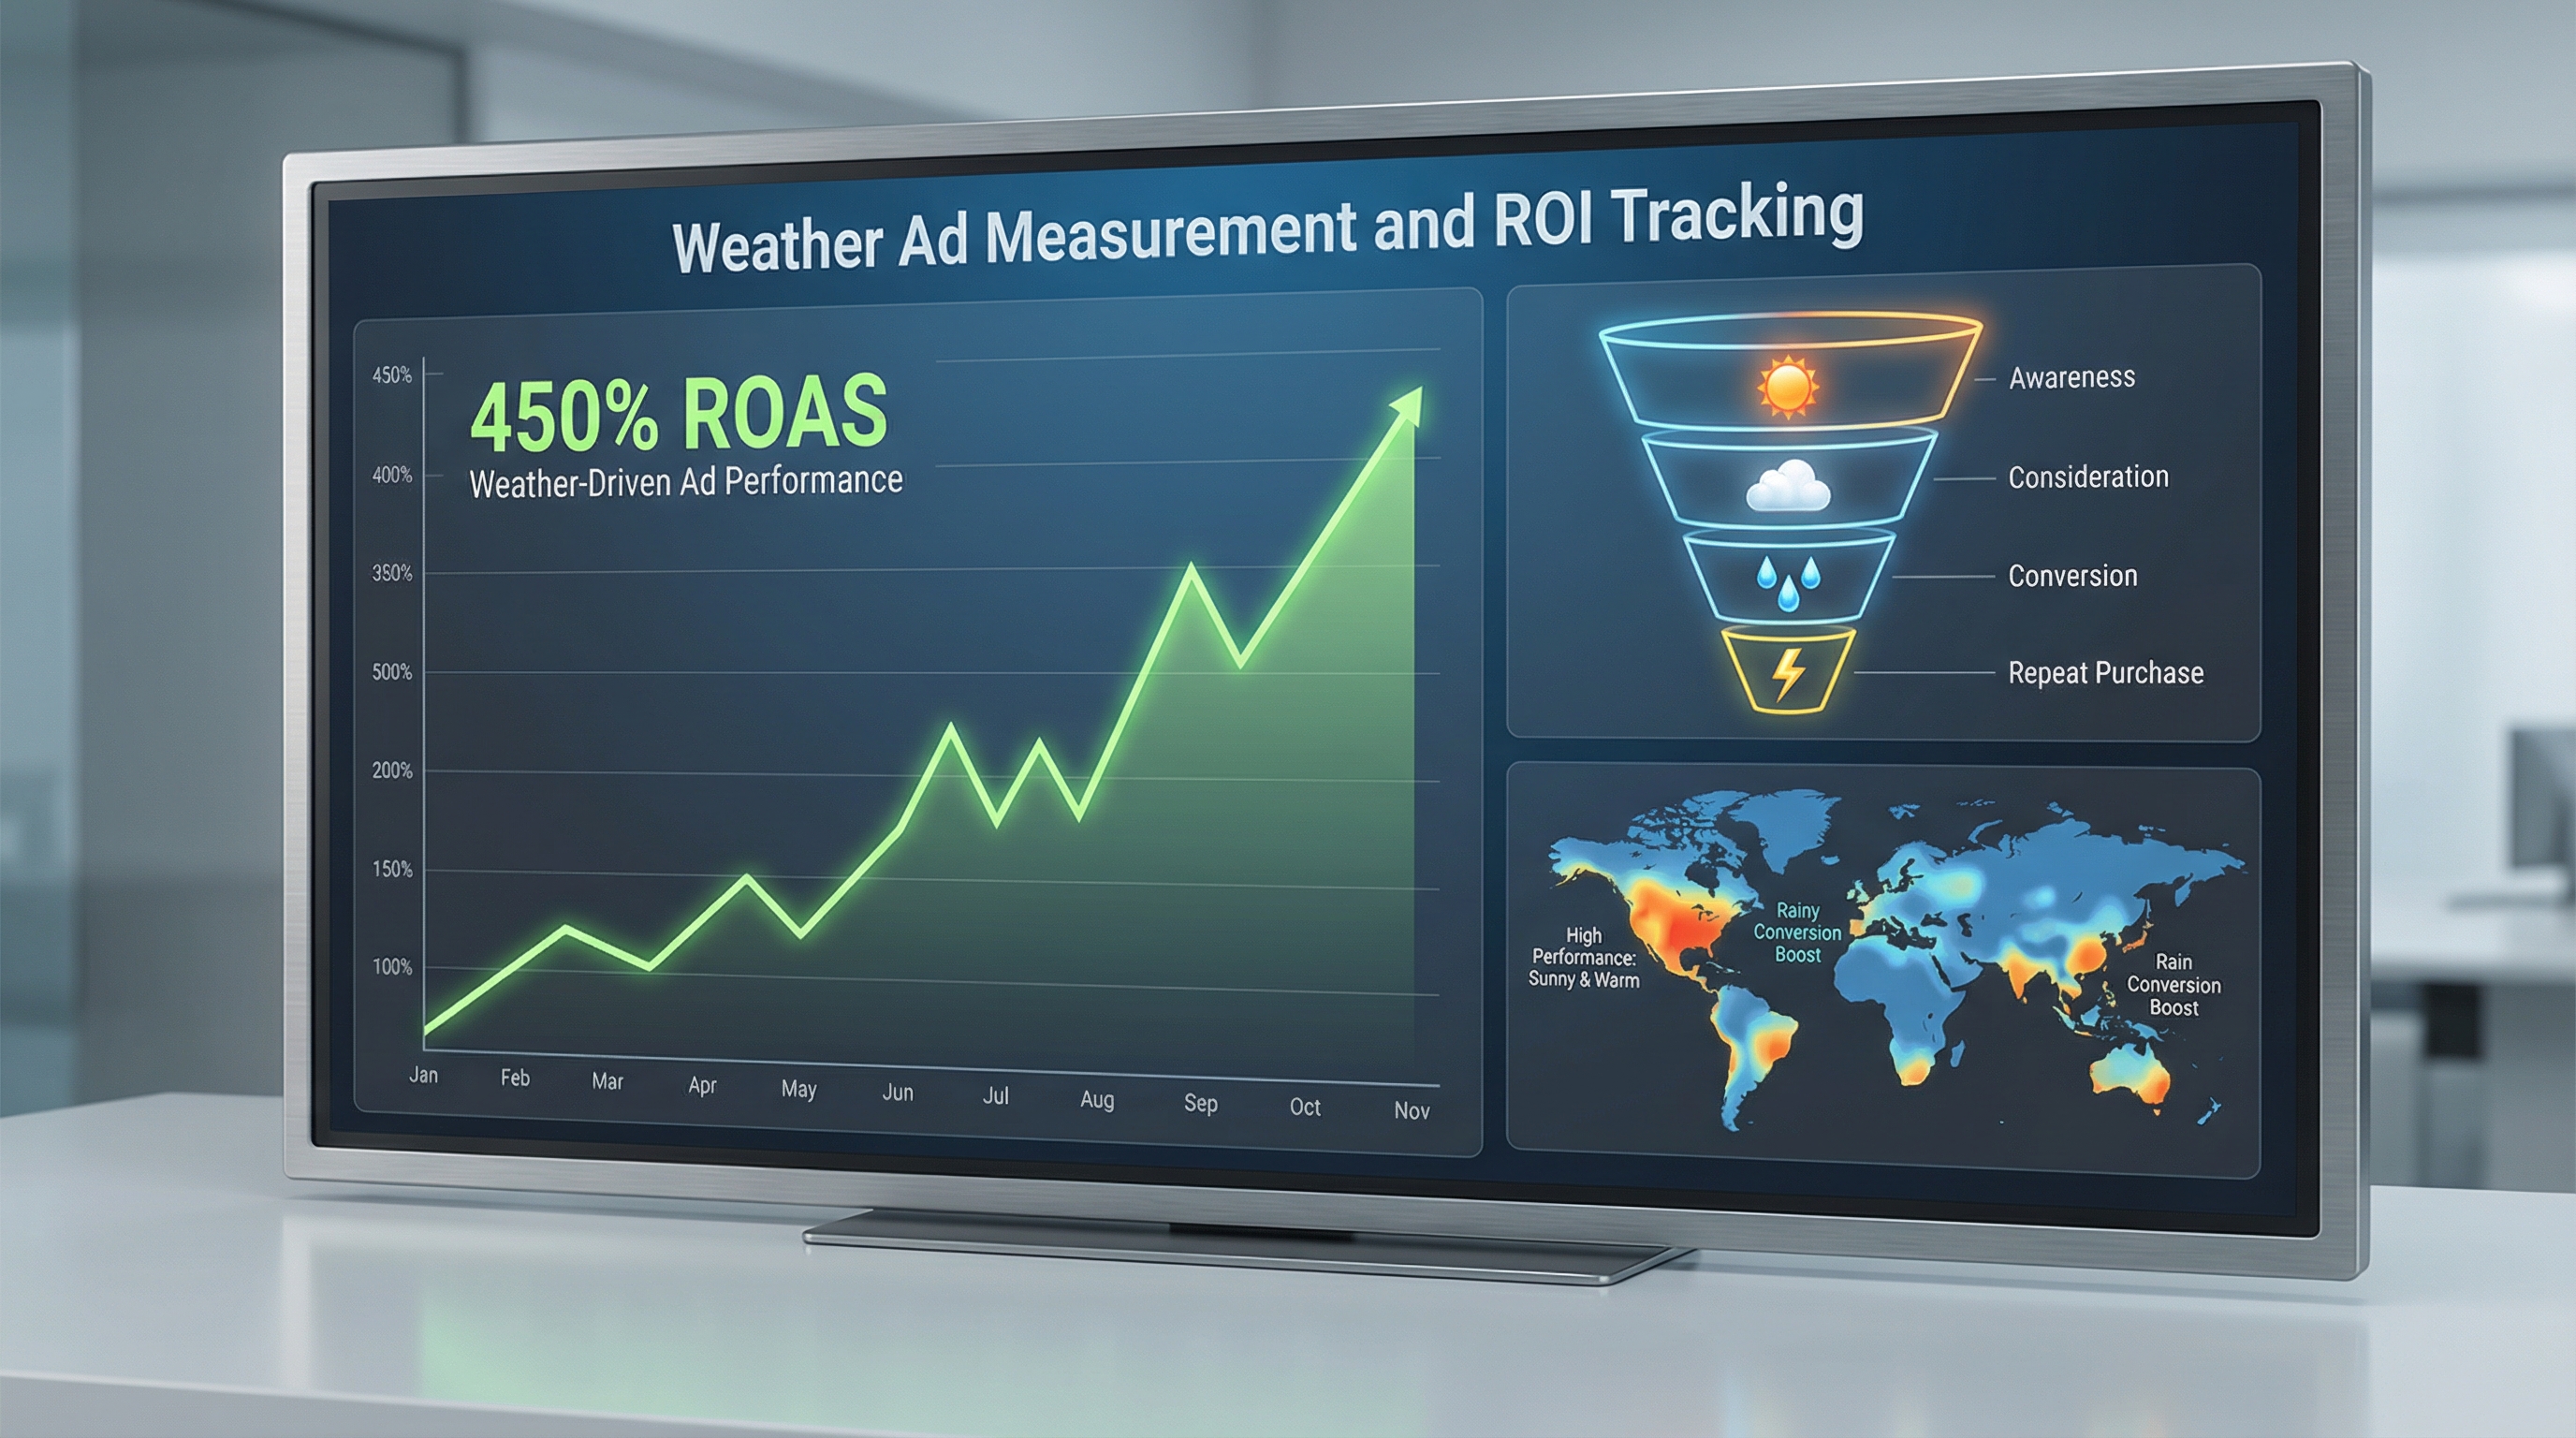
This is why weather campaigns typically show 3–5x higher ROAS than baseline campaigns. But without proper measurement, you’re flying blind. You might be capturing demand that was going to happen regardless, or you might be missing massive incremental wins buried in your data.
Key Metrics for Weather-Triggered Campaigns
Beyond traditional metrics like ROAS and CPA, weather-triggered campaigns require specialized KPIs that isolate weather’s effect on performance.
1. Weather-Attributed Conversions
Definition: Conversions that occurred during an active weather-trigger window, attributed to the weather condition and your ad.
Why it matters: This is your baseline. It answers the question: “How many sales happened during windows when my weather trigger was active?”
How to calculate:
Weather-Attributed Conversions = Conversions where [Weather Condition Met] AND [Ad Impressions Served] AND [Conversion Within Attribution Window]
Example: Your rule triggers ads when temperature drops below 40°F. You see 245 conversions on days when this trigger was active. That’s your baseline weather-attributed conversion count.
2. Incremental Lift (The True Measurement Win)
Definition: The difference in conversion rate between a weather-triggered campaign and a control group that didn’t receive the weather-triggered ads during the same period.
Why it matters: This isolates your ad’s incremental impact from natural demand driven by weather alone. A 25% incremental lift means your ads generated 25% more conversions than would have occurred due to weather alone.
How to calculate:
| Metric | Test Group (Weather Ads) | Control Group (No Ads) |
|---|---|---|
| Impressions | 50,000 | 0 |
| Conversions | 420 | 312 |
| Conversion Rate | 0.84% | 0.67% |
Incremental Lift = [(Test Rate – Control Rate) / Control Rate] × 100
Incremental Lift = [(0.84% – 0.67%) / 0.67%] × 100 = 25.4%
In this example, your weather ads generated 25.4% more conversions than would have occurred naturally. That’s the true measure of your campaign’s power.
3. Weather Correlation Score
Definition: A statistical coefficient (0.0 to 1.0) measuring the strength of the relationship between weather patterns and conversion spikes.
Why it matters: It validates that weather is actually driving your sales, not coincidence. A score of 0.65+ indicates strong weather correlation; below 0.4 suggests weak relevance.
How to calculate: Use Pearson correlation to compare daily weather metrics (temperature, humidity, precipitation) against daily conversion counts. Most modern analytics platforms (including WeatherTrigger) calculate this automatically.
4. Weather-Specific ROAS
Definition: Revenue generated per dollar spent on weather-triggered ads only, calculated separately from your baseline campaign spend.
Weather-Specific ROAS = Revenue from Weather-Triggered Conversions / Ad Spend During Weather-Trigger Windows
Example: You spent $2,100 on ads when your cold-weather trigger was active. Those ads generated $12,845 in revenue. Your weather-specific ROAS = 6.1x.
5. Cost Per Incremental Conversion
Definition: The cost of acquiring a conversion that wouldn’t have happened without your weather ads.
CPIC = Total Ad Spend / Incremental Conversions
Incremental Conversions = (Test Conversions – Control Conversions)
This is arguably the most important metric for true ROI calculation. It’s the only cost-per-acquisition metric that proves you’re creating new revenue, not just capturing existing demand.
Setting Up Proper Attribution: Control Groups and A/B Testing
Weather-triggered campaigns live or die on attribution methodology. Without a control group, you’re guessing.
Designing Your Control Group
A control group is a segment of your audience or geographic region that does not receive your weather-triggered ads during the test period, allowing you to measure baseline conversion rates.
Geographic control groups (recommended for weather):
- Exclude a region: Don’t run your rain-triggered umbrella ads in, say, Florida. Compare Florida’s conversion rate to other regions during rainy periods. Florida acts as your control.
- Schedule-based: Run weather ads on odd-numbered days only. Compare odd-day conversion rates to even-day rates within the same weather window.
- Budget split: Allocate 70% of your budget to the test group (weather ads), 30% to the control group (no weather trigger). Compare performance.
Key principle: Your control group must experience the same weather conditions as your test group. A geographic control only works if both regions have similar weather on the same day. A schedule-based control only works if weather patterns repeat daily. Choose the right control structure for your use case.
A/B Testing Weather Conditions
Don’t assume one weather trigger is optimal. Test multiple conditions:
- Temperature threshold: Compare ads triggered at 50°F vs. 40°F vs. 32°F
- Rain intensity: Heavy rain (>0.5″) vs. light rain (0.1–0.5″) vs. drizzle
- Forecast vs. real-time: Ads triggered by weather forecast 24 hours ahead vs. same-day weather
- Time window: Morning trigger vs. afternoon trigger vs. evening trigger
Run each test for at least 2–3 weeks to account for seasonal variation. Track incremental lift for each variant. Your most-winning condition becomes your core trigger rule.
Statistical Significance Threshold
Weather variability means you need larger sample sizes than standard campaigns. Aim for:
- Minimum conversions: 100+ conversions in test and control groups (both)
- Confidence level: 95% statistical significance (standard for digital marketing)
- Test duration: 3–4 weeks minimum to account for weekly variation patterns
Use this calculator to verify your sample size: Evan Miller’s A/B Test Calculator.
Platform-Specific Measurement Strategies
Google Ads and Meta Ads have different tracking capabilities. Here’s how to leverage each.
Google Ads: Using UTM Parameters and Custom Columns
UTM Strategy for Weather Campaigns:
| UTM Parameter | Value | Purpose |
|---|---|---|
utm_source |
Traffic channel | |
utm_medium |
cpc | Ad type |
utm_campaign |
weather_rain_trigger | Campaign name |
utm_content |
temp_below_40 | Specific trigger condition |
utm_term |
weather_auto_id_2026 | Rule/automation ID |
Custom Columns in Google Ads: Create a custom column that shows conversion rate for weather-triggered ad groups only:
Conversions / Impressions (for ad groups where utm_campaign = "weather_*")
This lets you compare weather-triggered ad group performance at a glance. Reference our Google Ads scripts guide for automation options.
Meta Ads Manager: Conversion Value Rules and Cohort Analysis
Meta’s measurement toolkit includes conversion value rules and audience cohorts, both valuable for weather campaigns.
Step 1: Create a custom audience for weather-triggered ad sets. In Meta Ads Manager, create a saved audience of users who have received a weather-triggered ad in the past 7 days.
Step 2: Use conversion value rules to tag weather conversions. If your pixel fires with a custom parameter indicating the conversion came from a weather-triggered session, use Meta’s conversion value rule feature to segment these conversions separately.
Step 3: Run cohort analysis. Compare the cohort that received weather ads against a similar demographic cohort that didn’t. Meta’s breakdown by demographic, device, and region lets you spot patterns.
For deeper automation, check our guide to triggering Meta ads via Make to sync weather conditions directly with your ad rule updates.
Google Analytics 4: Event-Level Weather Tracking
GA4 allows event-parameter tracking. Send weather data as parameters with your conversion events:
gtag('event', 'purchase', {
  value: 99.99,
  currency: 'USD',
  weather_trigger: 'rain',
  weather_temp: 42,
  weather_triggered_ad: 'yes'
});
This lets you build custom reports in GA4 that segment conversions by weather condition. Create a custom metric like “Purchase Conversion Rate (Weather Triggered)” to track this metric over time.
Calculating True ROI: The Complete Formula
Weather campaigns often report inflated ROAS because they’re capturing base demand. Here’s how to calculate true, incremental ROI.
Step-by-Step ROI Calculation
1. Calculate incremental conversions
Incremental Conversions = (Test Group Conversions) − (Control Group Conversions × [Test Impressions / Control Impressions])
2. Calculate incremental revenue
Incremental Revenue = Incremental Conversions × Average Order Value
3. Subtract cost of goods (COGS)
Net Incremental Profit = Incremental Revenue − (Incremental Conversions × COGS per Unit)
4. Calculate true ROI
True ROI = [(Net Incremental Profit − Ad Spend) / Ad Spend] × 100
Worked Example
Let’s say you’re running weather-triggered ads for an outdoor gear e-commerce store:
| Metric | Test Group | Control Group |
|---|---|---|
| Conversions | 580 | 420 |
| Ad Spend | $3,200 | $0 |
| Revenue per Conversion | $87 | $87 |
| COGS per Unit | $32 | $32 |
Incremental Conversions = 580 − 420 = 160
Incremental Revenue = 160 × $87 = $13,920
Net Profit (after COGS) = $13,920 − (160 × $32) = $13,920 − $5,120 = $8,800
True ROI = [($8,800 − $3,200) / $3,200] × 100 = 175%
Your true ROI is 175%, not the naive calculation of ($50,460 revenue / $3,200 spend = 1,576% ROAS). The 175% figure accounts for the natural demand that would have converted anyway.
Common Measurement Mistakes (and How to Avoid Them)
Mistake #1: Confusing Correlation With Causation
The error: Rain correlates with umbrella sales, so you assume your rain ad caused the sale.
Reality: The customer needed an umbrella because it was raining. Your ad may have accelerated the decision or shifted which brand they chose, but the base demand existed.
How to fix it: Always use a control group. Without one, you’re claiming causation without proof.
Mistake #2: Ignoring Seasonal Confounds
The error: Comparing winter campaign performance to summer and claiming weather attribution, when the seasonal time-of-year is actually the driver.
Reality: People buy snow shovels in winter regardless of ads. Your attribution model needs to separate “time of year” from “weather condition within that time of year.”
How to fix it: Test weather triggers within the same season. Run a cold-trigger campaign for 4 weeks in January, compare days with temps below 30°F (ad-receiving) to days with temps above 40°F (no ad, same season).
Mistake #3: Geographic Bias in Control Groups
The error: Using one region as control and another as test, when the regions have different baseline conversion rates or customer demographics.
Reality: California and Minnesota don’t have the same customer profile. Weather frequency, customer seasonality, and purchasing power differ. A 2% lift in California might not be the same value as a 2% lift in Minnesota.
How to fix it: Use within-region testing (odd days vs. even days) or 30/70 budget splits within the same region. Alternatively, ensure your test and control regions have similar historical conversion rates before starting the experiment.
Mistake #4: Attribution Windows That Are Too Long
The error: Attributing conversions that occur 7–14 days after a weather-triggered ad impression, when weather has changed completely.
Reality: Weather events are transient. A cold snap lasts 2–3 days. Someone who converts 10 days later probably forgot the ad and made the purchase for a different reason.
How to fix it: Use a 24–48 hour attribution window for weather campaigns. Set 24 hours as your default; extend to 48 if your product requires research/consideration time.
Mistake #5: Not Accounting for Frequency Capping Effects
The error: Assuming all ad impressions are equally weighted, when viewers who see 5+ weather ads have different conversion behavior than those who see 1.
Reality: Ad fatigue and reinforcement both matter. After 3 impressions in a day, additional impressions might have negative ROI.
How to fix it: Build custom metrics for “conversion rate by frequency band” (impressions 1–2 vs. 3–5 vs. 6+). Optimize your frequency cap to maximize ROAS, not just impressions.
Tools and Technology for Weather Ad Measurement
You don’t need to build measurement infrastructure from scratch. Here are the best tools for weather campaign tracking:
Google Ads Scripts (Free, In-Platform)
Google Ads Scripts allow you to automate UTM parameter generation and custom column creation. This is the easiest way to start isolating weather campaigns in your reporting.
See our Google Ads scripts guide for a production-ready example.
Make (formerly Integromat)
Make is perfect for connecting weather data APIs to your ad platforms. Use it to automatically trigger ads based on real-time weather conditions, then log those triggers for measurement.
Read how to trigger Meta ads via Make for implementation details.
Google Analytics 4 with Custom Events
GA4’s event-parameter system is the most flexible free option for weather-specific conversion tracking. Build custom segments and audiences based on weather data.
Mixpanel or Amplitude (Paid)
For advanced cohort analysis, these customer analytics platforms excel at segmenting users by custom event properties (like weather trigger condition). Price starts ~$995/month but includes team collaboration and retention analysis.
Statsig or LaunchDarkly (Experimentation Platforms)
If you’re running frequent weather A/B tests, these platforms automate control group assignment, statistical significance testing, and variance analysis. They’re designed for continuous experimentation (starting ~$500/month).
Building a Weather Advertising Dashboard
A good weather ad dashboard shows four things: real-time weather conditions, active ad performance, incremental lift, and ROI. Here’s the template:
Dashboard Components
Panel 1: Weather Status (Real-Time)
- Current temperature, precipitation, humidity (for each geographic region)
- Active triggers (which rules are currently firing)
- Time since last trigger event
Panel 2: Active Ad Performance (24-Hour)
- Impressions served (test + control)
- Conversions by group
- Click-through rate
- Cost per conversion (test group only)
Panel 3: Incremental Lift (Weekly Aggregate)
- Incremental conversions
- Incremental lift percentage (with confidence interval)
- Cost per incremental conversion
Panel 4: ROI & Revenue (Monthly
- True ROI percentage
- Net profit (after ad spend and COGS)
- Cumulative incremental revenue
- Performance vs. previous month
Tool recommendation: Google Data Studio (free) + Google Sheets backend is the easiest setup. Build your custom metrics in Sheets, then visualize in Data Studio. Alternatively, WeatherTrigger’s native dashboard handles all of this automatically.
Case Study Examples: Real Metric Improvements
Case Study #1: Home Improvement Retailer (Cold Weather Trigger)
Setup: E-commerce retailer selling heating supplies, snow removal gear, and winter home weatherization products. Triggered ads when temperature forecasted to drop below 35°F.
| Metric | Before Weather Trigger | After Weather Trigger |
|---|---|---|
| Baseline ROAS | 1.8x | 3.2x |
| Incremental Lift (vs. control region) | — | +34% |
| True ROI | — | +218% |
| Monthly Ad Spend (weather campaigns) | — | $8,400 |
| Monthly Incremental Profit | — | $28,300 |
Key insight: The 3.2x ROAS looked great, but the true story was the 34% incremental lift and 218% ROI. The control region (non-weather-triggered) had a 1.2x ROAS, showing that base demand existed. Weather targeting captured 160+ incremental conversions per month that wouldn’t have happened otherwise.
Case Study #2: Quick-Service Restaurant Chain (Heat Wave Trigger)
Setup: National QSR chain triggered cold drink promotions when temperature forecasted to exceed 92°F. Tested three regions: test group (weather ads), control group (no ads), and holdout group (always-on ads).
| Region/Group | Avg Daily Transactions | Cold Drink Orders | Ad Spend (10 days) |
|---|---|---|---|
| Test (Weather Ads, 92°F+) | 1,847 | 421 | $2,100 |
| Control (No Ads, 92°F+) | 1,792 | 298 | $0 |
| Holdout (Always-On Ads, 92°F+) | 1,810 | 312 | $2,100 |
Findings:
- Incremental lift: (421 − 298) / 298 = +41% cold drink orders from weather-triggered ads vs. control
- CPIC (Cost Per Incremental Conversion): $2,100 / (421 − 298) = $17.07 per incremental order
- Incremental profit: 123 extra orders × $8.50 margin = $1,045 incremental profit on $2,100 spend
- True ROI: ($1,045 − $2,100) / $2,100 = −50% (negative!)
The lesson: Even a 41% lift can be unprofitable if your margins are thin. This company learned they needed higher-margin products (combo meals, add-ons) in their weather trigger to achieve positive ROI.
How WeatherTrigger Solves Weather Ad Measurement Challenges
Building measurement infrastructure manually is time-consuming and error-prone. WeatherTrigger was built specifically to solve weather attribution at scale.
WeatherTrigger’s built-in measurement engine provides:
- Automatic control group assignment: WeatherTrigger segments your audience into test/control groups automatically, tracking performance separately. No setup required.
- Real-time weather correlation scoring: We calculate the Pearson correlation coefficient between your weather conditions and conversion spikes, validating that weather is actually driving performance.
- Incremental lift calculation: Our dashboard shows incremental conversions and lift percentage with 95% confidence intervals, accounting for daily variance.
- Weather-specific ROAS isolation: See the ROAS of weather-triggered campaigns separately from your baseline, without manual UTM configuration.
- Cross-platform consolidation: Track performance across Google Ads, Meta Ads, and custom APIs in one dashboard.
- Automated attribution window optimization: We test different attribution windows (24h, 48h, 72h) and recommend the one with strongest correlation to weather.
Learn more: Read our comprehensive guide to weather-triggered ads or what weather-triggered advertising actually is.
Building Your Measurement Dashboard in WeatherTrigger
WeatherTrigger’s native dashboard displays all measurement metrics automatically. Here’s what you’ll see:
- Performance by trigger: Each of your weather rules shows its own incremental lift, ROAS, and revenue contribution.
- Weather correlation heatmap: Visual representation of which weather conditions correlate strongest with conversions.
- Control group comparison: Side-by-side stats for test vs. control segments with statistical significance indicators.
- Cumulative ROI: Running total of net profit from all weather campaigns, minus ad spend.
If you’re not ready to switch platforms, WeatherTrigger integrates with your existing Google Ads and Meta accounts—you get the measurement benefits without replacing your current ad management workflows.
Frequently Asked Questions
Q: How long should I test a weather trigger before claiming statistically significant results?
A: Minimum 3–4 weeks, depending on your conversion volume. If you see 100+ conversions in both test and control groups, you’re likely at 95% confidence. Use this calculator: Sample Size Calculator.
Q: What’s the difference between attribution window and conversion window?
A: Attribution window is the period after an ad impression during which you credit conversions to that ad (e.g., 24 hours). Conversion window is the period after a weather event during which people are likely to purchase due to that weather. They’re often mismatched. For weather campaigns, align your attribution window to the typical purchase cycle of your product (usually 24–48 hours for urgency-driven weather purchases).
Q: Should I use different attribution models for different weather conditions?
A: Yes. A hot-weather trigger for iced beverages might have a 12-hour window (people need drinks fast). A cold-weather trigger for heating systems might need 48 hours (research time). Test each trigger’s optimal attribution window separately.
Q: How do I measure weather campaign ROI if I don’t have a formal control group?
A: Use a schedule-based control. Run weather ads on odd-numbered days; hold odd days as control. Compare odd-day conversion rate to even-day conversion rate within the same weather window. Less precise than geographic controls but better than nothing. Ensure both cohorts experience similar weather patterns.
Q: Can I use forecast-based triggers and still measure attribution accurately?
A: Yes, but your attribution window needs adjustment. If you trigger ads 24 hours before weather occurs, extend your attribution window to 48–72 hours to capture conversions during and after the actual weather event. Use your correlation score to validate that forecast-based targeting still correlates with conversions.
Start Measuring Your Weather Campaign ROI
Weather-triggered campaigns deliver 3–5x higher ROAS than standard campaigns—but only if you measure them correctly. Stop guessing at attribution. Start tracking incremental lift, correlation scores, and true ROI with automated measurement.
Get started with a free ROI audit: We’ll analyze your current campaign data, identify weather correlation patterns, and show you the incremental revenue you might be missing.