Weather Ad Measurement: How to Tell If Weather-Triggered Ads Actually Work
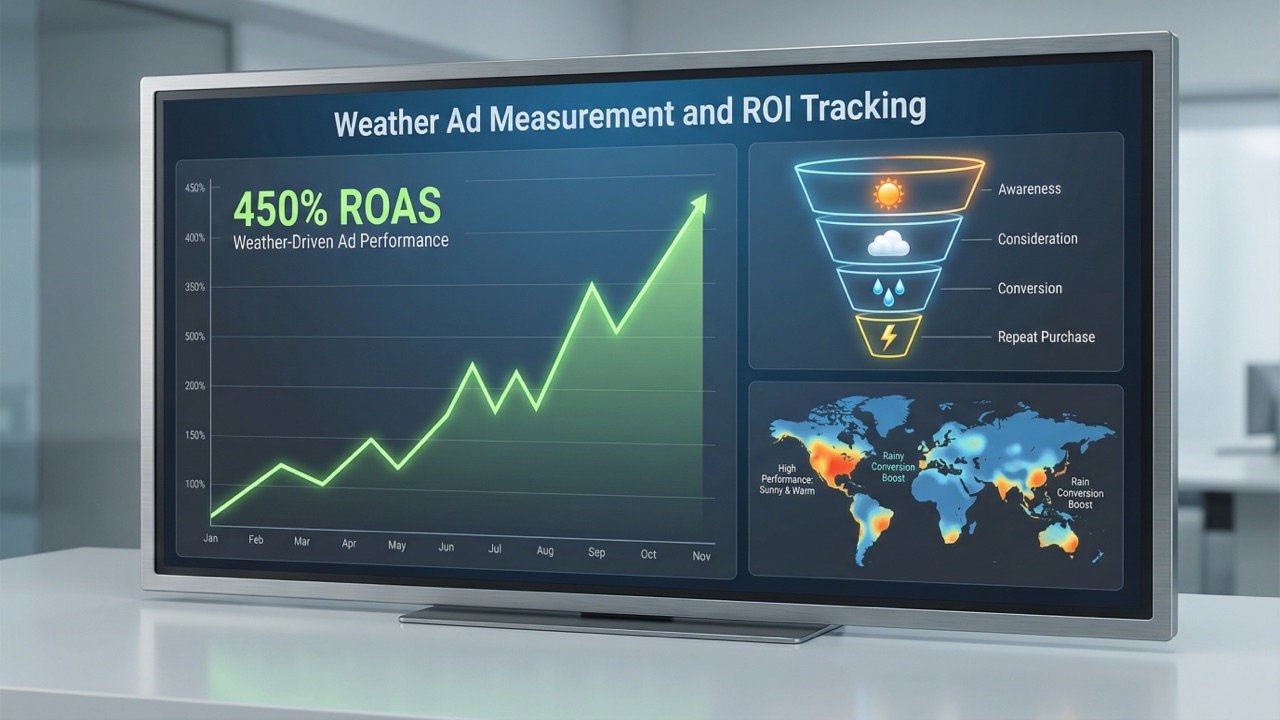
Weather-triggered ads almost always look good in a standard report. That’s the problem. Weather creates demand on its own, so ads that run when it rains pick up sales that rain would have caused anyway. A high ROAS on a rainy-day campaign tells you little about whether the ads made a difference.
This guide shows how to measure the part that matters: the extra sales your ads caused.
Why weather ads are hard to measure
Think of a rain-triggered ad for umbrellas. On rainy days, umbrella sales rise. Your ads run on rainy days. Some of those sales came from your ads, and many would have happened anyway.
Last-click attribution and platform ROAS credit the ads with all of them. A comparison with the days your ads didn’t run doesn’t help either, because those days had different weather.
The only reliable approach is to compare against a control: people, places or times with the same weather where your rule didn’t run.
For on/off rules there’s a second question too: what happened when the ads were switched off? If your ad set is paused on dry days and sales barely change, that’s money saved. Good measurement looks at both sides.
What studies show about weather ad ROI
There’s no reliable average return for weather-triggered ads. Most published figures come from vendors, often with no control group. The few that compare against something:
- Molson Coors, Canada (2013). Weather-specific Facebook ads had a 67% lower cost per click than the brand’s generic ads (agency-reported).
- wetter.com (2023). Weather-scripted Google app campaigns reported 14% better in-app retention than always-on campaigns, at the same cost per install (vendor-reported).
- Display banners, Germany (2017). In a field experiment on a weather website, the same banner got 40% more clicks in rain and 34% more in cold than in good weather (peer-reviewed, one site and one ad).
You may also see the claim that matching ads to the weather “can lift ROI by up to 18%”. That figure comes from a vendor-commissioned brain-imaging study of 182 people, and the ROI was modelled from neural responses rather than measured in sales. Treat numbers like these as a reason to test, not a forecast. The methods below tell you what weather-triggered ads return for your business.
Four ways to measure
From most to least reliable:
1. Platform lift tests
Meta and Google both run lift studies that randomly hold back part of your audience and compare conversions between people who could see your ads and people who couldn’t.
- Meta Conversion Lift measures incremental conversions from a campaign. Availability depends on your account and spend, so check in Ads Manager or with your Meta rep.
- Google Conversion Lift, including geography-based studies, is available for eligible accounts and campaign types.
These are the strongest evidence you can get, but they need reasonable conversion volume and often an account team to set up.
2. Geo holdouts
Run your weather rule in some regions and not in similar ones, then compare. This is the most practical method for most advertisers.
- Pick matched regions. Choose test and control regions with similar weather, similar customers and similar sales history. Two suburbs of the same city work better than two different cities.
- Measure the normal ratio. Before you start, record sales in each group over a few weeks with no weather rule running. This gives you the usual ratio between them.
- Run the rule in the test regions only. Leave the control regions on your normal setup.
- Compare on trigger days. When the weather meets your rule’s conditions in both groups, compare actual sales in the test regions with what the normal ratio predicts.
3. Alternating weather events
If you only operate in one area, alternate: run the rule for one weather event, skip the next, and so on. Then compare sales on “on” events with “off” events. It’s less precise than a geo holdout because no two storms are the same, but it’s far better than nothing.
4. Before and after
Comparing a period before the rule with a period after it is the weakest method, because the weather and the season will have changed. If you have to use it, compare days with similar weather only, in the same season.
A worked example
This example is illustrative, not a customer result.
The business: a hardware retailer with an online store. It runs a cold-snap rule that switches on ads for heaters and electric blankets when the forecast low drops below 2°C. It tests the rule in three regions and holds back two similar ones.
Before the test: over four weeks with no rule running, the test regions had 1,200 orders and the control regions had 1,000. So the test regions normally sell 1.2 times as much as the control regions.
During the test: over 10 cold-snap days, both groups had the same cold weather.
| Test regions (rule on) | Control regions (rule off) | |
|---|---|---|
| Orders on cold-snap days | 690 | 480 |
| Ad spend | $1,900 | $0 |
The calculation:
- Expected orders without the ads = control orders × normal ratio = 480 × 1.2 = 576
- Incremental orders = actual − expected = 690 − 576 = 114 (a 19.8% lift)
- Cost per incremental order = $1,900 ÷ 114 = $16.67
- Incremental profit = 114 orders × $45 margin per order = $5,130
- Return on ad spend, after margin = ($5,130 − $1,900) ÷ $1,900 = 170%
Now compare that with what a standard report would show. All 690 orders at a $110 average order value is $75,900 of revenue on $1,900 of spend, a ROAS of about 40x. The ads were profitable, but by 170%, not 40 times over.
Keep your units consistent
The most common error in this kind of calculation is mixing daily figures with totals. If orders are averaged per day, the spend must be per day too. If spend covers 10 days, orders must cover the same 10 days. Mixing them can turn a strongly profitable result into an apparent loss, or the other way round. An earlier version of this page made exactly that mistake.
Metrics worth tracking
- Incremental conversions: actual conversions minus the expected number from your control.
- Lift: incremental conversions as a percentage of the expected number.
- Cost per incremental conversion: ad spend divided by incremental conversions. Compare it with what a customer is worth to you.
- Incremental profit after ad spend: incremental conversions × margin, minus ad spend.
- Spend avoided: for on/off rules, how much the ad set didn’t spend while paused, and whether sales in that period fell compared with the control.
How much data you need
There’s no fixed number of conversions that makes a result significant. It depends on how big the lift is and how much your sales vary from day to day. A small lift on noisy sales needs a lot of data. A large lift on steady sales needs much less.
Use a sample size calculator with your normal conversion rate and the smallest lift you care about. Then count weather events, not calendar weeks. Ten rainy days spread over two months tell you more than one wet week.
Tracking setup
- Name weather ad sets and campaigns clearly so you can filter them, for example
WX | Rain | Brisbane | Storm repairs. - Tag landing page URLs with UTM parameters, for example
utm_campaign=wx_rain_storm_repairs, so your analytics tool can separate weather-triggered traffic. - Break down results by region in Meta Ads Manager and Google Ads, so you can compare test and control areas.
- Pick attribution settings that fit the product. For urgent purchases, a short window such as Meta’s 1-day click setting shows the effect more clearly. Keep the setting the same in the test and control groups.
- Keep a log of every switch and the weather reading that caused it, so you can line results up against conditions.
- Build a simple dashboard. Looker Studio (free) on top of a Google Sheet is enough: daily orders by region, whether the rule was on, and the weather.
What WeatherTrigger records
WeatherTrigger logs every check: the weather reading for each location, whether your rule’s conditions were met, and what it did to each ad set. That gives you the exact on and off periods you need for the comparisons above.
It doesn’t run lift tests or calculate incremental results for you. To set up a geo holdout, create the rule for your test locations only and leave the control locations on your normal setup.